Accessing Grafana
An instance of Grafana has been pre-installed in your EKS cluster. To access it you first need to retrieve the URL:
k8s-grafana-grafana-123497e39be-2107151316.us-west-2.elb.amazonaws.com
Opening this URL in a browser will bring up a login screen.
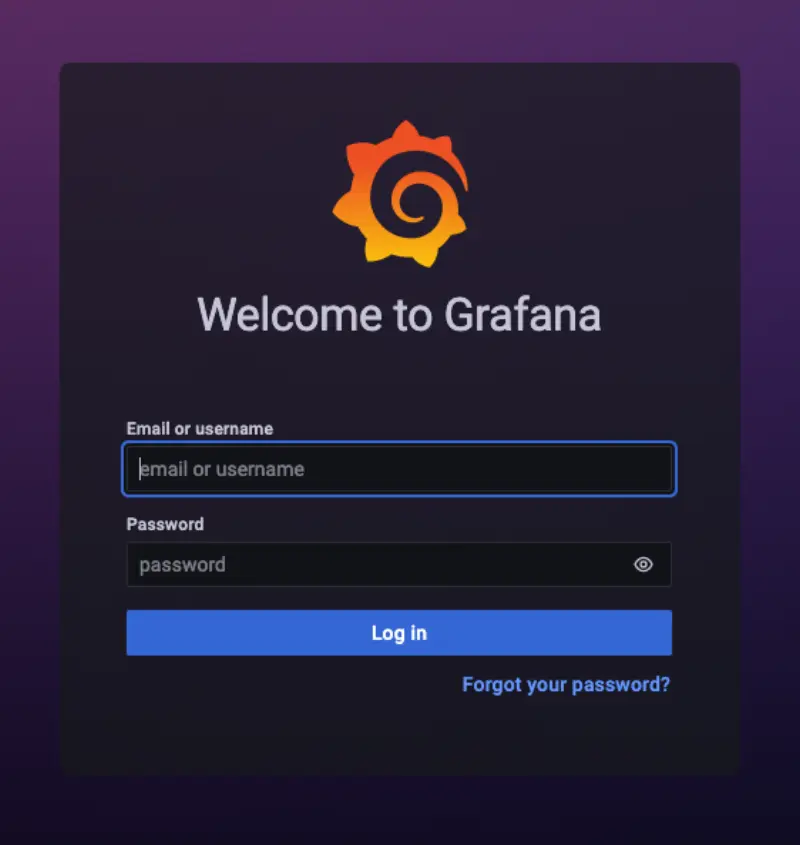
To retrieve the credentials for the user query the secret created by the Grafana helm chart:
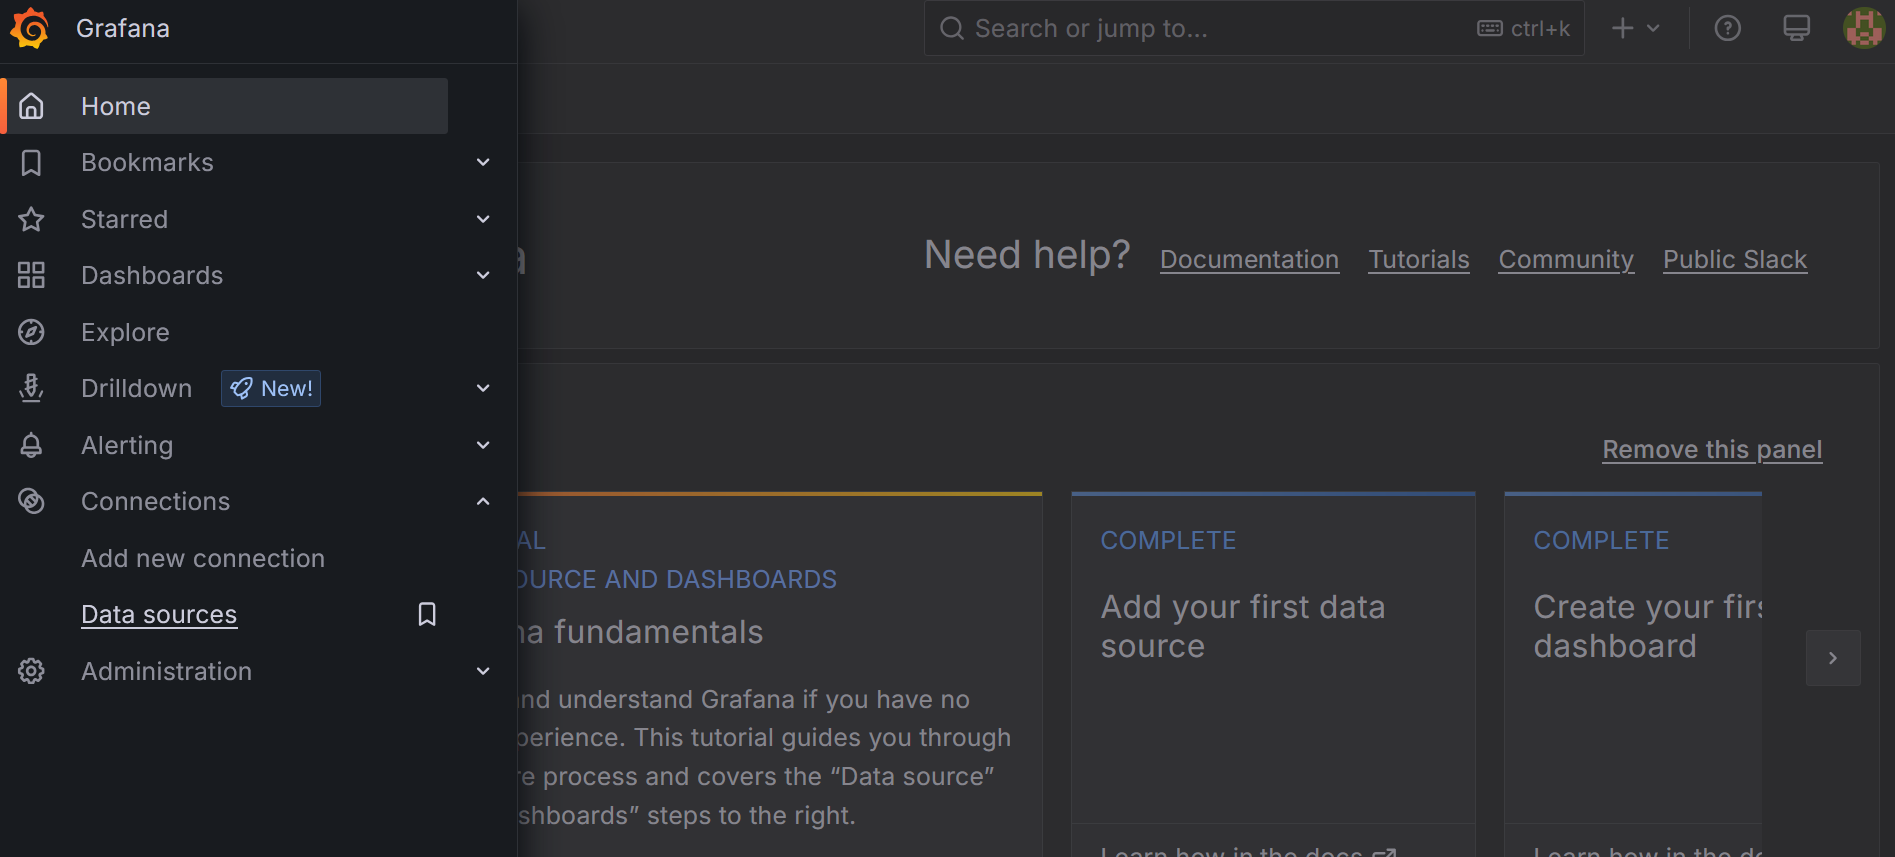
After logging into the Grafana console, let's take a look at the datasources section. You should see the Amazon Managed Service for Prometheus workspace configured as a datasource already.
This lab runs a self-managed Grafana inside the cluster to keep the setup simple. In production you would typically prefer Amazon Managed Grafana, a fully managed service that AWS operates in collaboration with Grafana Labs:
- Nothing to operate — AWS provisions, patches, scales, and provides high availability for Grafana, so there are no servers or version upgrades for you to manage.
- Enterprise plugins through AWS — you can upgrade a workspace to use Grafana Enterprise data source plugins directly through AWS, without a separate Grafana Labs Enterprise license.
- AWS-native security — users sign in through AWS IAM Identity Center or SAML, with access governed by AWS Identity and Access Management.
- Built-in AWS data sources — native integration with Amazon Managed Service for Prometheus, Amazon CloudWatch, and more.
An Amazon Managed Grafana workspace can query the same Amazon Managed Service for Prometheus workspace you use in this lab as its data source.