Cluster dashboards
Let's head over to the dashboard section and visualize the EKS cluster metrics collected by the CloudWatch agent.
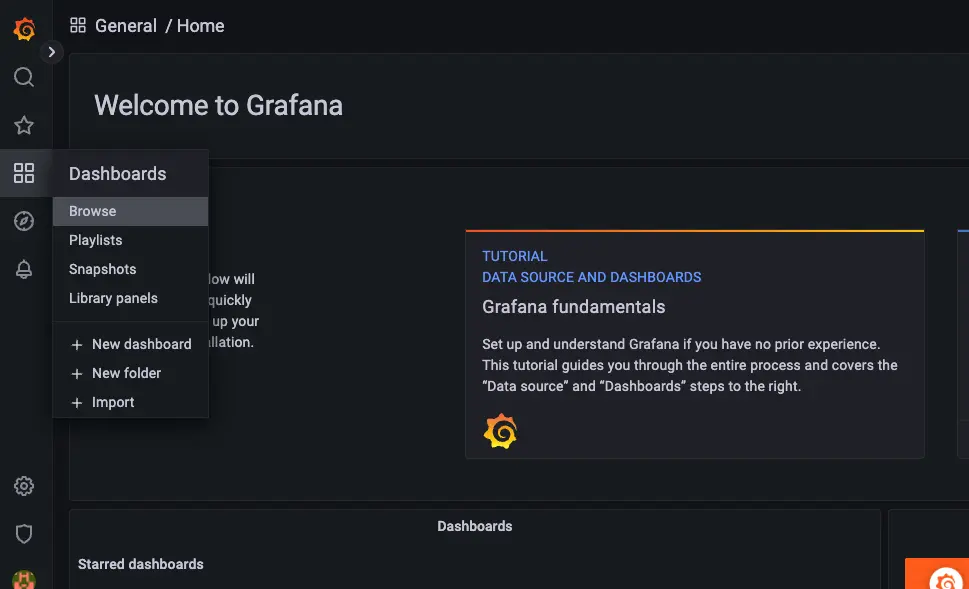
Click the dashboard Kubernetes Cluster Monitoring and let's review a panel within the dashboard.
The Total Usage panel shows the overall cluster usage of CPU, memory and filesystem.
